
Why one story may need eleven views
What should a timeline, relationship graph, map, or whiteboard tell you? Learn how Scroll views read the same Story data from different angles.
An author planning a missing-person novel builds three excellent outlines. A spreadsheet tracks characters and clues. A timeline records movements before and after the disappearance. A whiteboard connects suspects to motives. The system works—until she moves the disappearance from ten on Friday night to one on Saturday morning.
The spreadsheet changes. The timeline does not. A witness statement on the whiteboard still points to the old time. A few days later, the author is no longer sure which version describes the current story.
The problem is not that she used too many visual tools. The problem is that every visual became another container for story facts. What she needed was a clearer division: let each view provide a way to look, without making each one responsible for storing a separate story.
That distinction is the starting point for Scroll and its 11 built-in Story views: a view is not a second story. It is a way to ask a particular question of the same Story data.
Separate the records from the point of view
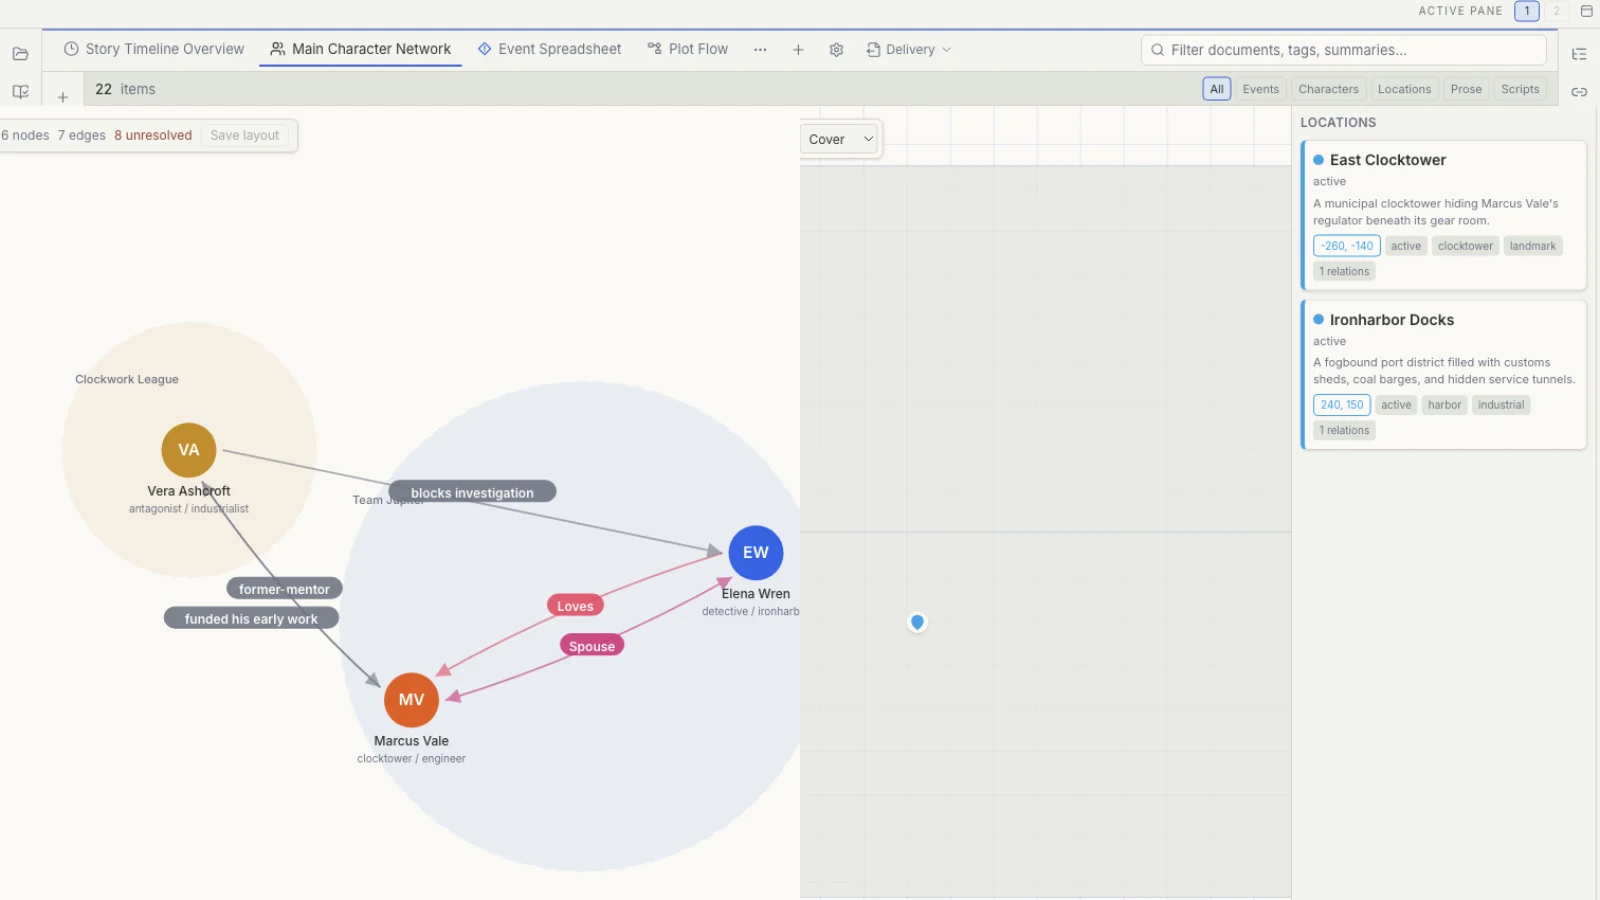
Character, location, organization, and event cards can provide a shared source inside a Project. A Spreadsheet arranges fields. A Timeline lays events out by date. A Relationship graph centers on explicit relations and, when enabled in the view settings, can overlay read-only connections derived from shared events and similar records. A Map works from location information. Saving a view preserves its scope, filters, groups, sorting, and appearance rather than copying a new set of cards.
Think of a camera. A scene does not become a second place when the photographer changes lenses. The frame changes because the question changes.
This does not mean every Story view changes records in exactly the same way. Nor should an author assume that moving a card on any canvas will safely rewrite dates, hierarchy, or relationships everywhere. Views are working surfaces. When a critical field changes, the author still needs to understand what was edited and verify the result. A common source reduces duplicate maintenance; it cannot guarantee that the source itself is correct.
The 11 built-in Story views are Spreadsheet, Gallery, Calendar, Timeline, Gantt, Subway, Relationship graph, Map, Mindmap, Whiteboard, and Flowchart. All 11 are included with Scroll Free. The useful question is not how many you can open. It is what you need to learn next.
Are the records complete? Start with Spreadsheet and Gallery
Spreadsheet is good at exposing blanks. Do key events have dates? Are characters missing a status or affiliation? Has one location been recorded twice under slightly different names? When you need to compare fields, filter a set of cards, or find inconsistent values, structured rows are often more revealing than a dramatic diagram.
Gallery supports recognition. In a cast or setting with many similar names, images and short summaries help answer “Is this the person I meant?” or “Are these two places actually the same?” Gallery makes records easier to browse; it does not establish chronology.
In the missing-person novel, Spreadsheet first reveals that several events have no participants. Gallery then shows that “Riverside Warehouse” and “Old Quay Warehouse” share a similar image even though they are different places. A beautifully rendered Timeline would merely display incomplete input more elegantly.
When a visual view looks strangely empty, resist the urge to create duplicate cards. A date-driven or coordinate-driven view may simply lack the fields it needs. Return to the records and decide whether the missing precision matters to this story.
Where does time break? Ask four different time questions
Time views are not four skins placed over the same answer.
Calendar asks what happens on a particular day or within a month. It exposes density and gaps: three critical events crowded into Saturday morning, an empty Sunday, or a character appearing on Wednesday despite claiming to be away all week.
Timeline asks how time advances in the story world. It places events separated by hours, months, or generations along one chronology, helping an author review order, interval, and echoes across periods.
Gantt emphasizes duration, phases, and overlap. A siege is not a single instant. An investigation may occupy several weeks. When duration itself creates a condition in the story, a range is more informative than one date.
Subway follows character appearances over time and shows where narrative lines intersect. It can reveal when two people enter the same event, when a viewpoint disappears for too long, or when the same witness has been placed in incompatible scenes.
Back in the disappearance case, Timeline shows that a statement was made before the police report. Gantt reveals that the port closure began before the suspect’s claimed departure. Subway places the investigator on opposite sides of the city during the same period. No single view “won.” The author asked three different questions: order, duration, and participation.
If the source describes an event as “late at night” or “years earlier,” no view can calculate a reliable answer from ambiguity. An author may choose to preserve that uncertainty. The important thing is to recognize it as a narrative decision, not a gap the software will fill by itself.
Who is connected, and where can they go?
A Relationship graph is sometimes treated as decoration for a pitch deck. During writing, its more useful purpose is to inspect recorded relationships: which organization a character belongs to, who is connected to an event, and how a chain of interests passes through several people. Explicit relations remain the formal records; optional read-only connections derived from shared events can add another angle on participation.
The graph works from what the Project has recorded. It does not read the prose and infer a formal relationship, and two names appearing in the same chapter do not automatically create one. Read-only derived connections trace their source records rather than becoming editable relations. A line sketched on a Whiteboard for speculation does not need to become canonical Story data. Keeping text mentions, exploratory links, derived connections, and confirmed relationships distinct prevents a temporary theory from quietly becoming fact.
Map asks spatial questions. Could a character travel from the hotel to the quay in time? Have two locations been placed in contradictory directions? Does a chase route make sense? A Map will not replace geographic research or prove real travel conditions, but it can make a contradiction visible enough to investigate.
An empty Map is not evidence that a card disappeared. The location may not have coordinates or the relevant positioning information. Decide whether this story needs that precision. Add it when it matters; do not invent it merely to fill the screen.
When the idea is still unstable, keep the canvas open
Structured data is useful for relatively stable facts. Story discovery often begins before stability. Three canvas views support different kinds of uncertainty.
Mindmap expands outward from a central question. “Why did she choose to disappear?” might branch into fear, protection, exchange, and misdirection, with each motive opening into the conditions it would require.
Whiteboard lets research fragments, cards, clues, and revision questions gather into temporary constellations. Spatial proximity can mean “these may be connected” without demanding a formal relationship.
Flowchart makes causality and choices visible. If the witness tells the truth, what follows? If he lies, how does the investigation reach a different suspect? A branch can reveal circular reasoning or the missing step between cause and consequence.
The author might use Mindmap to explore motives, Whiteboard to cluster unresolved clues, and Flowchart to test two investigative paths. After a hypothesis survives contact with the draft, she decides whether it should become a confirmed relationship or event property. Exploration is valuable precisely because it can remain provisional.
Reduce the choice to three routes
If the records seem incomplete, begin with Spreadsheet and Gallery. One checks fields and consistency; the other helps you recognize cards. If the same kind of information is repeatedly missing, the problem may have shifted from “Which view?” to “How should this Project record it?” Continue with Templates Are Not Story Formulas.
If you are checking Story facts, choose the window that matches the question. Use Calendar for date distribution, Timeline for chronology, Gantt for duration and phases, Subway for intersecting character lines, Relationship graph for recorded relations and optional read-only derived connections, and Map for movement and location. Comparing these views can help the author notice contradictions; the author still decides what the prose and story should do about them.
If the idea is not yet stable, use Mindmap, Whiteboard, and Flowchart to expand, cluster, and test. Let a possibility become Story data once its meaning is ready to hold.
Specialist tools may offer different priorities and deeper treatment of one domain. Scroll’s choice is to keep multiple viewing angles close to the same Project, its cards, and its prose. Visualization can expose a conflict; it does not choose the authoritative version of the story for you.
A linear short story may need nothing more than a folder and one small table. View count is not a measure of artistic seriousness. If a view does not answer a real question, there is no prize for opening it.
The simplest sequence is: missing fields, use Spreadsheet; dates, duration, or appearances, choose the matching time view; connections and movement, use Relationship graph or Map; unstable ideas, stay with the canvases.
See the precise view boundaries in the Scroll Story planning guide, or return to the Long-Form Writing Guide to reconsider the current block. Start by naming the question. Then choose the lens.